UIC GIS Day 2018 celebrates innovation with hands-on application of new technologies.
“ A stimulating and useful” day was enjoyed by participants in GIS Day 2018. GIS day is an annual event celebrating spatial analytics and geographic information systems worldwide. This year, GIS day at UIC offered a variety of formats to share content and to network, enabling scholars and professionals alike to view the many different ways that GIS and visualization can address a wide range of problems.
The UIC Library and Urban Data and Visualization Laboratory (UDVL) co-sponsored this year’s event on Nov 16 for a crowd of over 75 faculty, students, and professionals from Chicago’s leading academic and government institutions. The event was made possible through the generous support of the SÖÖt family.
Presentations began with a demonstration of the advanced statistical methods of GIS software provided by Dr. Tekleab Gala from Chicago State University: Scaling-up Spatiotemporal Dynamics and controls of HIV/AIDS Prevalence Rates of Sub-Saharan African Countries. HIV/AIDS continues to take its toll across Africa, but Dr. Gala and his students wondered if trends in the rate of infection were clustered spatially. Sure enough, spatial statistics available with GIS software improved prevalence models and identified the cultural practices and demographic explanations for decline. With this information, Dr. Gala hopes these lessons can be applied across sub-saharan Africa. In the meantime, his research will continue to create models at even finer scale for greater specificity.
“How do we harness a readily available resource to map biodiversity of the planet?” asked Dr. Tanya Berger-Wolf from UIC’s Department of Computer Science. The resource is, surprisingly, the imagery and video collected by users of social media across the globe. Wildbook, a cloud-based geodatabase, collects, identifies, maps, and monitors photos of large animals, from zebras to elephants to whale sharks, using machine learning and artificial intelligence to help address fundamental questions of conservation policy and research. Dr. Berger-Wolf and her team are redefining how animal census is being conducted and leveraging the power of maps, citizen science, and machine learning for conservation.
People often ask Dr. Stephen Kleinschmit of UIC’s Department of Public Administration what data analytics has to do with civics. “Well, a surprising number of ways”, he answers. Dr. Kleinschmit’s presentation included many manifestations of social media, network analysis, sorting, and visualization for the advancement of public service. A particularly timely example of “disinformation” was provided: the manifestation and spread of rumors through social media about significant catastrophic events such as mass shootings or natural disasters. A demonstration of NodeXL could summarize 18,000 tweets into a single colorful, and intelligible graphic. Similar visualizations can be derived from Flikr, Facebook, or YouTube.
Devin Lavigne is co-founder of HousealLavigne, a company specializing in planning, design, and economics. Lavigne has been working with GIS products since the late 1990s, before ArcMap was available and users faced down the DOS-based IDRISI software. Today his firm has won national awards from the American Planning Association and uses at least 20 different geodesign software tools; including, SketchUp, Insight for ArcGIS, Unreal Engine, and GeoPlanner.
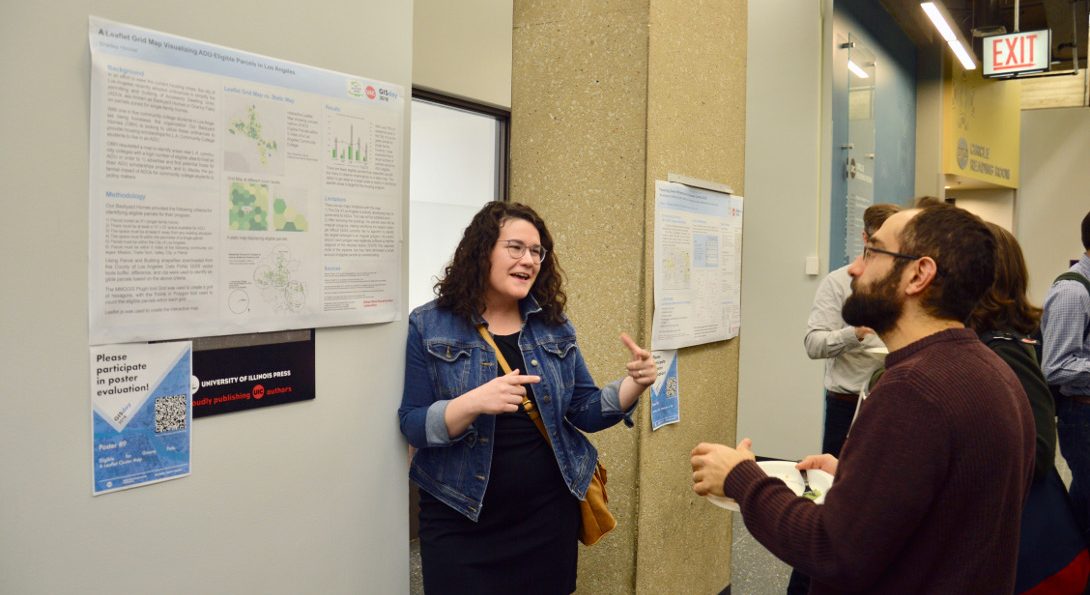
The afternoon was filled with interactive sessions. New this year was an opportunity to present research during a poster session, including novel work on transit accessibility and need assessment, geospatial urban infrastructure data, geographic distribution of energy efficiency, best practices on CAD to GIS data conversion, among others. The award for best poster went to Shelley Hoover for her work, A Leaflet Grid Map Visualizing ADU-Eligible Parcels in Los Angeles. After lunch, attendees had a choice between workshops for the afternoon: QGIS 3: New Features and Techniques was presented by Cassie Follett, of DePaul University, and uGRIDD: A Georeferenced Big Data Platform presented by Zhong Chen.
GIS day 2018 was a vibrant event, covering a breadth of topics, and using a variety of software to visualize, analyze, and plan for our future. UDVL was proud to create a venue where researchers, students, and practitioners could come together and explore the power of spatial analysis and visualization. We are happy to share Dr. Soot’s sentiment that UIC, UDVL, and our partners across the region are really “into maps”.