Highlights from UIC GIS Day 2019
UIC GIS Day 2019: Geospatial Exploration of Community And Global Disparities In An International Context
GIS Day at UIC is an annual event celebrating spatial analytics, geographic information systems, and visualization techniques that allow us to organize, analyze, and communicate data. GIS Day 2019 was a stimulating day to explore different aspects of Community and Global Disparities, through a keynote speaker, talks and interactive panels, a poster session and competition, and a hands on-workshop, all shedding light on different aspects of disparities in both national and international contexts.
The UIC Library and Urban Data and Visualization Laboratory (UDVL) co-sponsored the event on November 22nd for a crowd of over a hundred faculty, students, and professionals from Chicago’s leading academic, private, and government institutions. The event was made possible through the generous support of the Sööt Family Foundation as well as award sponsorships from Esri and UrbanGIS.
The day started with an inspiring keynote talk by Tonika Lewis Johnson. Tonika, a Chicago-based social justice artist, featured The Folded Map™ Project, an impactful visual representation of segregation in Chicago. The Folded Map™ Project connects Chicagoans with corresponding addresses on the North and South sides through conversation, photography, multimedia exploration, video interviews, and the interactive maps made by the UDVL team. Using this array of visualization techniques, she presented what urban segregation looks like and how it affects Chicago residents.
People talk to each other and change each others’ decisions. Diffusion of information and decision making are closely related. The second talk introduced an advanced analytical technique to account for the impact of the spread of information on individuals’ decisions on use of healthcare facilities. Dr. Jonathan Ozik, Senior Scientist in the Consortium for Advanced Science and Engineering, presented how patients’ choice of healthcare facilities is affected differently by diffusion of information, comparing clinical dosing (from their healthcare providers) and social dosing (from their peers). Using the CommunityRx case, a multi-level information-based healthcare intervention on the South Side of Chicago, Dr. Ozik presented his highly disaggregated agent-based modeling to explore how social ties influence outcomes.
Yolanda Richards, ESRI’s Economic Development Professional, shared different applications of ESRI’s advanced technologies in visualizing disparities. The Chicago 1919 is an application of ESRI Story Maps to help us see where and when riots took place and who was injured in these events. The Cascade app allows user to see income segregation in Chicago, where almost 21% of residents live below the poverty line while the top 1% earn more than $600,000.
Income segregation and access to jobs have a strong interaction. High-tech industrial zones are now the major source of jobs, income, and growth in the U.S.. Using spatial statistics techniques enable us to find their location and sectoral type. Dr. Ahoura Zandiatashbar, geospatial data scientist at UDVL, presented his work on identifying the location and sectoral typology of high-tech zones in the U.S., using a micro-level firm data set. The work has showed 627 zones in the U.S. that are mostly home to diverse high-tech industries. Attendants familiar with Chicago region, learned where these zones are and how different they are from each other (e.g., bio-tech zones, professional services zones, etc.). The discussion centered around the potential negative effects of these zones on the existing residents, such as displacement.
The afternoon was filled with interactive sessions and networking between researchers and attendees. More than twenty research teams presented posters depicting spatial analysis and visualization of socioeconomic disparities in housing affordability, transportation equity, urban food systems, environmental science, and public health in both national and international contexts (e.g., Dhaka, Kenya). New this year, poster winners were awarded an individual ArcGIS Personal Use license, and free GIS training session by professionals in UrbanGIS company.
The first place winners, Abolfazl Seyrfar (PhD student in Civil Engineering) and Tony Canepa (Master student of Urban Planning and Policy), showed that transit-dependent populations in Chicago are living in transit deserts.
Karissa Frazier and Erica Petersen (Master students of Public Health) came in second place, bringing maps of initial findings about access to health facilities and health services among the residents in Rural Kenya.
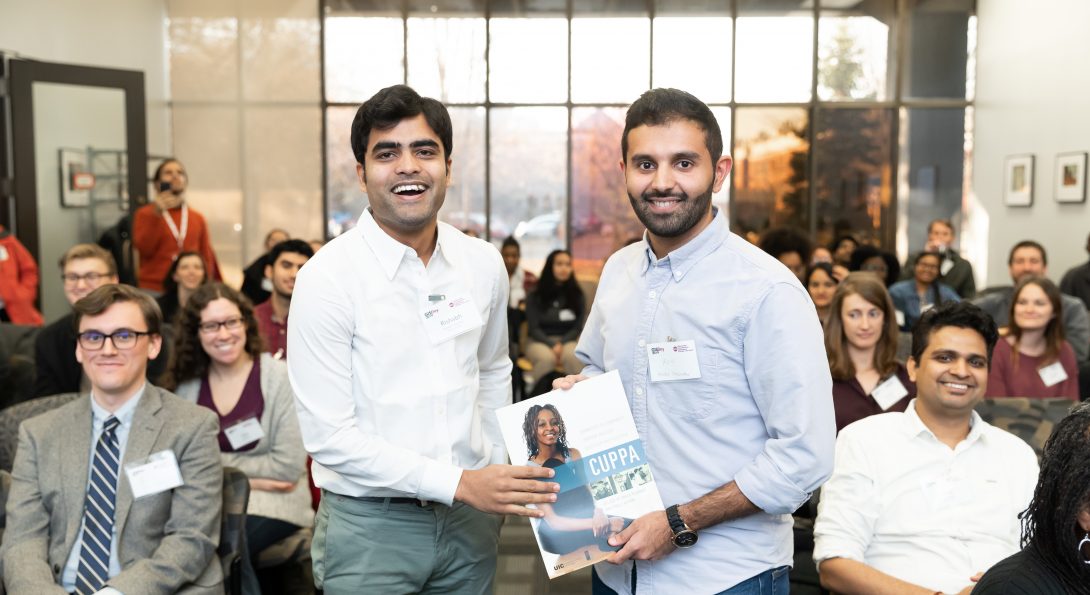
Rishabh Chauhan and Abdulaziz Alahmadi (PhD students in Civil Engineering), third-place poster winners, compared access to rapid transit systems across major U.S. cities.
GIS Day 2019 was a vibrant event, covering a breadth of innovative techniques and impactful applications. UDVL was proud to create a venue where researchers, students, and practitioners could come together and explore the power of spatial analysis and visualization to understand and address community and global disparities.