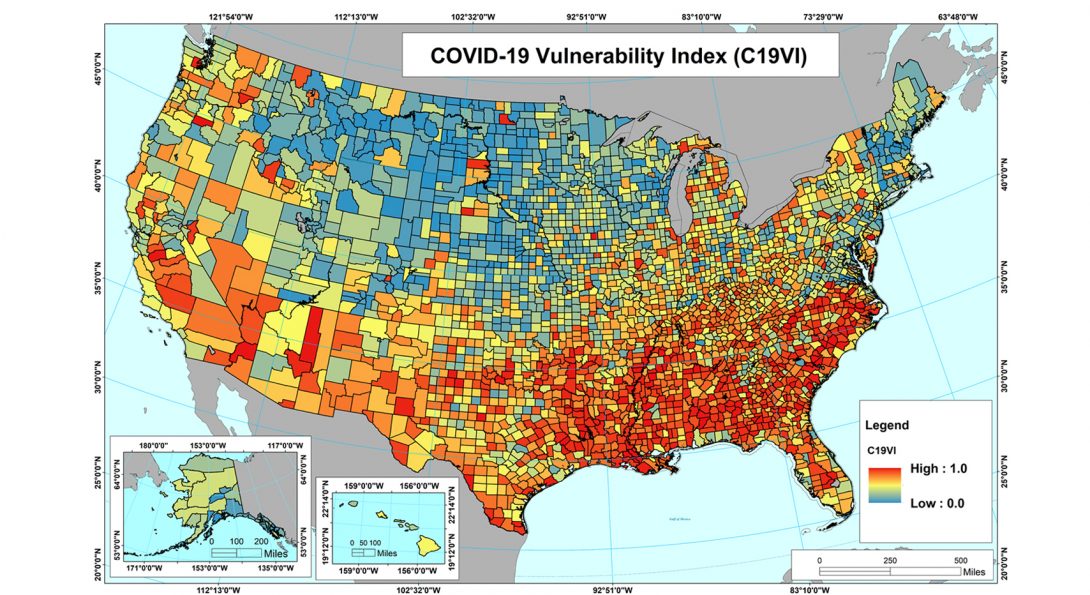
National COVID-19 Vulnerability Index (C19VI)

Introduction
COVID-19 is now the third most likely cause of death in the United States after heart disease and cancer. The situation is worse among racial minorities and economically poor communities, which are disproportionately affected by the health and the economic impacts of the COVID-19 pandemic. To identify community resilience against COVID-19, the Centers for Disease Control and Prevention (CDC) developed a nationwide COVID-19 Community Vulnerability Index (CCVI), which was built on the CDC’s Social Vulnerability Index (SVI). In order to determine vulnerability specific to COVID-19, epidemiological risk factors and public health system capacity themes were integrated with SVI indicators. The CDC CCVI, however, assigns equal weights to all factors and does not account for the non-linear nature of vulnerability. The biggest challenge in the development of multiplicative and non-linear vulnerability models is the lack of methods relating to the resilience of communities to coronavirus infection with a massive spread of the infection and the human loss due to it.
Our study introduced a Random Forest (RF) machine learning-based COVID-19 Vulnerability Index (C19VI) using CDC’s six themes: (a) socioeconomic status, (b) household composition & disability, (c) minority status & language, (d) housing type & transportation, (e) epidemiological factors, and (e) healthcare system factors. RF uses ensemble learning with recursive partitioning to compute non-linear relationships between input themes in the best possible manner. An innovative ‘COVID-19 Impact Assessment’ algorithm was also developed using homogeneity analysis (Pettitt’s Test) and temporal trend assessment techniques (Mann-Kendall and Sen's slope estimator) to train the RF model. Trend analysis analyzes the spread and severity of the pandemic for potential trends, which indicate a sign of chronic disease burden, while homogeneity assessment identifies abrupt changes in temporal trends, indicating a sign of healthcare infrastructure and policy impact (lockdown phases). Our C19VI index was compared with CDC’s CCVI using advanced statistical measures and a machine learning model.
Next, C19VI was used to assess the disproportionate impact of the pandemic on minority and low-income communities. Looking at values of C19VI against racial composition and poverty datasets revealed that seventy-five percent of Black Americans and eighty-two percent of poor Americans are in high COVID-19 vulnerable zones. The ‘COVID-19 Map Viewer’ provides access to our ‘C19VI’, ‘COVID-19 Vulnerability (Racial Minority) - C19VI’, and ‘COVID-19 Vulnerability (Poverty) - C19VI’ layers.
Our innovative way to conduct COVID-19 vulnerability research takes advantage of both the well-established field of statistical analysis and the fast-evolving domain of machine learning. Furthermore, the optimized impact assessment algorithm and high training (90%) and testing (84%) accuracy with a favorable internal reliability score (Cronbach’s α = 0.7) of the non-linear RF vulnerability-modeling, all make C19VI a reliable COVID-19 vulnerability and risk assessment tool. The findings from our impact assessment algorithm show how the vulnerability is driven by the chronic disease burden, healthcare infrastructure, and policy impact. This index will help the emergency planners and public officials prioritize and map the communities that need support during and after the COVID-19 pandemic.
Team Details
- Anuj Tiwari (Ph.D.), Discovery Partners Institute, UIC, Chicago. Email: anujt@uic.edu
- Arya V. Dadhania (B.S., MS2), College of Medicine, UIC, Chicago.
- Vijay Avin Balaji Ragunathrao (Ph.D.), Department of Pharmacology, UIC, Chicago.
- Edson R. A. Oliveira (Ph.D.), Department of Microbiology and Immunology, UIC, Chicago.
Tiwari, Anuj, Arya V. Dadhania, Vijay Avin Balaji Ragunathrao, and Edson R. A. Oliveira. "Using Machine Learning to Develop a Novel Covid-19 Vulnerability Index (C19vi)." (2020), https://ui.adsabs.harvard.edu/abs/2020arXiv200910808T
Acknowledgment
Special thanks to Dr. Moira Zellner, Director, Urban Data Visualization Lab (UDVL), CUPPA, UIC, Chicago for her continuous encouragement, collaboration, and guidance and Anton Rozhkov, Ph.D. Candidate, Urban Data Visualization Lab (UDVL), CUPPA, UIC, Chicago for customizing the Web Map Viewer.