UPP 462 | Fall 2021
Final Project Showcase
In Fall 2021, the class produced 9 individual projects on a variety of topics. The purpose of this final project is for students to demonstrate their ability to integrate multiple advanced GIS tools (e.g., Network Analyst, ModelBuilder, Python, Spatial Statistics, and/or Spatial Analyst) to address some questions – hypothetical or real – of a geospatial nature. Students have several weeks at the second half of the semester to develop research questions, investigate the topic of their interest, explore GIS tools to address their questions and produce the final visuals. Students had three options for the final report: prepare ArcGIS StoryMap, scientific poster, or traditional report. All options could be seen in this showcase. Thanks to all the students for your hard work during the semester.
Instructor - Anton Rozhkov
1. A discussion of methodology and analysis regarding Leon County’s cycling infrastructure and crash incidents. Heading link
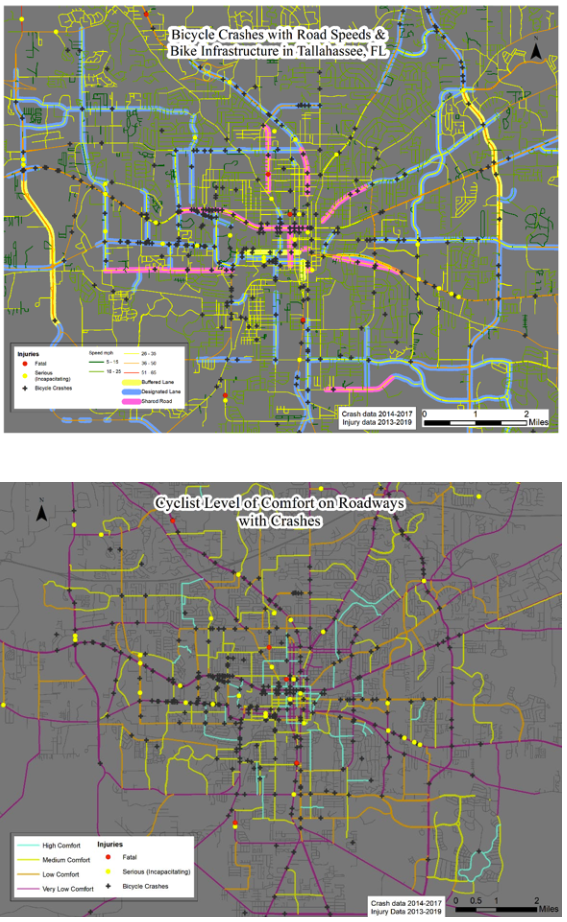
Author: Kayla Mae Davis
The purpose of this project was to look at cycling crashes in Leon County, FL, and infer possible correlations between incidents and the built environment. Kayla Mae hypothesizes that there will be evidence to suggest that cycling infrastructure provides some mitigation towards cycling crashes; and, conversely, that higher road speeds exacerbate cycling crashes. Kayla Mae looked at elevations and slopes of roadways to see if there is any data that suggests that hills also play a role in incidents. Ultimately, this data provides a sense of the most dangerous spaces in Leon County for cyclists through documented crashes, and that data can provide insight into roadways to focus on to implement better cycling safety measures.
2. The pandemic's effects on Chicago arrests Heading link
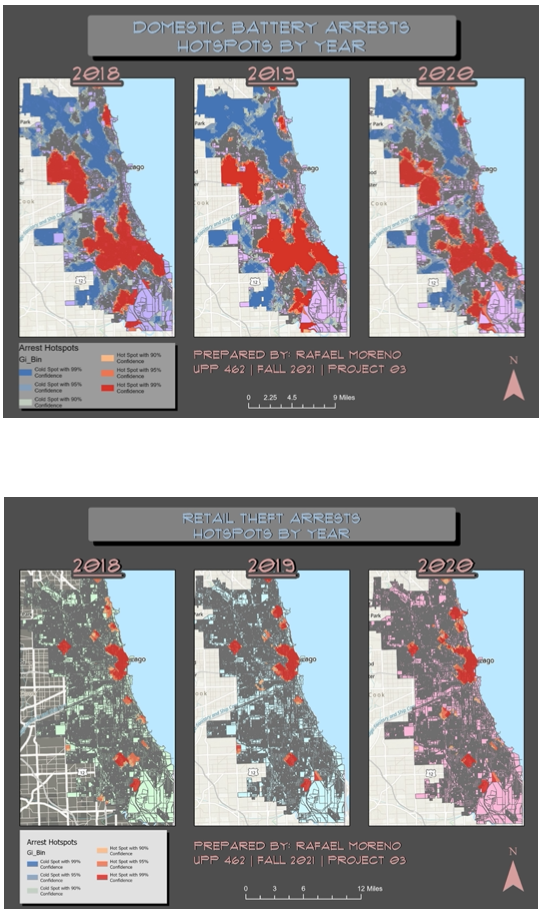
Author: Rafael Moreno
Rafael looked at the arrests that have occurred in Chicago during 2020. A massive (over 1 million observations) arrest dataset from the city of Chicago that has arrests by type, address, etc. was analyzed. This data covers the year 2014 to 2020. Rafael explored if there are any differences in arrests in the years leading up to and including 2020 to note any differences given the pandemic.
3. Comparing environmental impact (and its causes) with environmental conditions in the Chicago metropolitan area Heading link
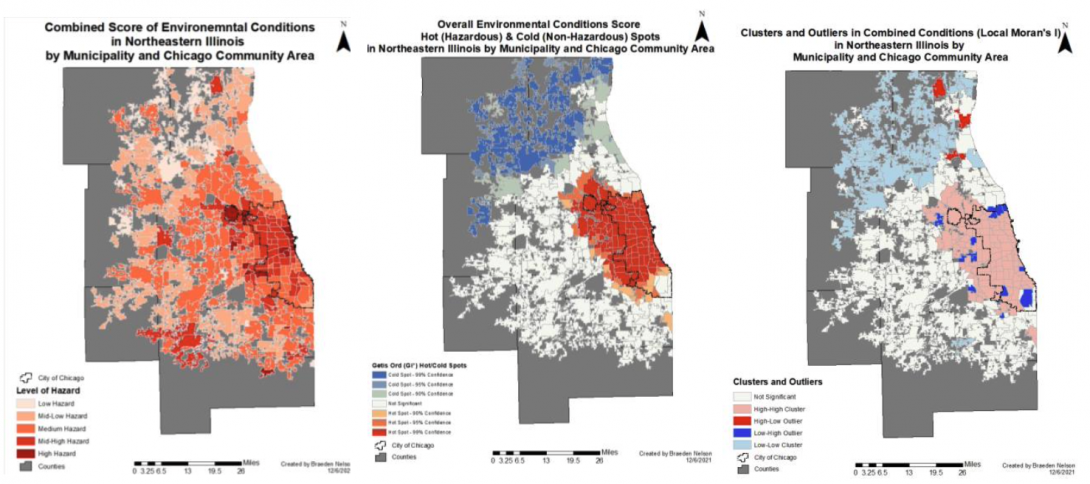
Author: Braeden Nelson
Braeden explored the environmental impact of suburbs as compared to cities. In particular, how do the consumption, land use, and transportation patterns of suburbs contribute to climate change and other environmental problems. Braeden addressed these issues through a geospatial analysis of environmental impacts and environmental conditions in northeastern Illinois, or the Chicago metropolitan region. Braeden hypothesized that areas that contribute the most to environmental problems will be suburban areas because they are structured as primarily single-family residential areas that are the most dependent on cars for transportation. Braeden also hypothesized that the areas of the highest environmental impact (suburban areas) will deal with less environmental hazards than areas of the least environmental impact (urban areas).
4. Mapping COVID Vaccination Rates using EBK analysis. A case study between Los Angeles and New York City Heading link
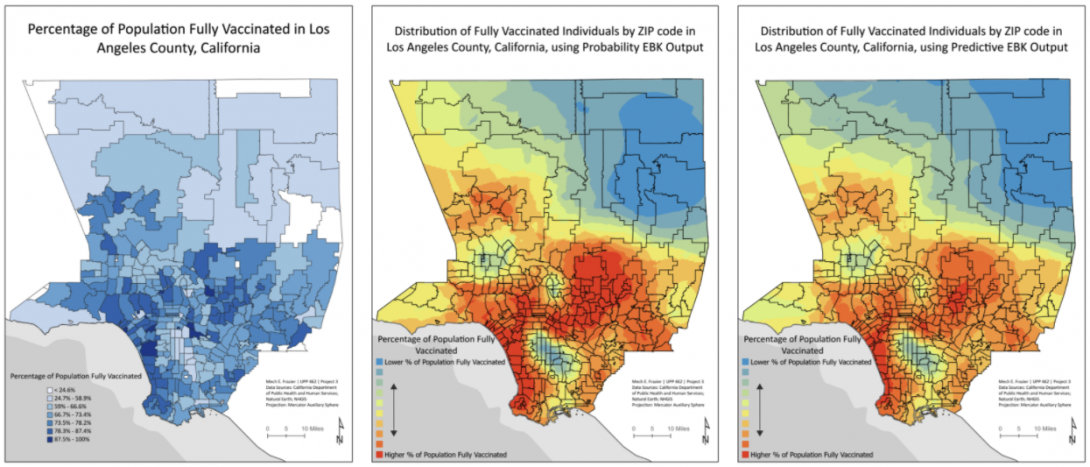
Author: Mech Frazier
Two research questions frame this project. The first focuses on an exploratory analysis of EBK methodology and creating a valid kriging model, while the latter focuses on conclusions drawn from comparing election data to the EBK results.
- If EBK analysis builds a valid kriging model from point data that is sporadically spatially distributed, will continuous polygon data produce similar results? Further, will EBK analysis using polygon geometry produce results similar to a choropleth map?
- If political ideology influences vaccine hesitancy, then pro-Trump precincts will have a lower percentage of fully vaccinated individuals, while pro-Biden precincts will have a higher percentage of fully vaccinated individuals.
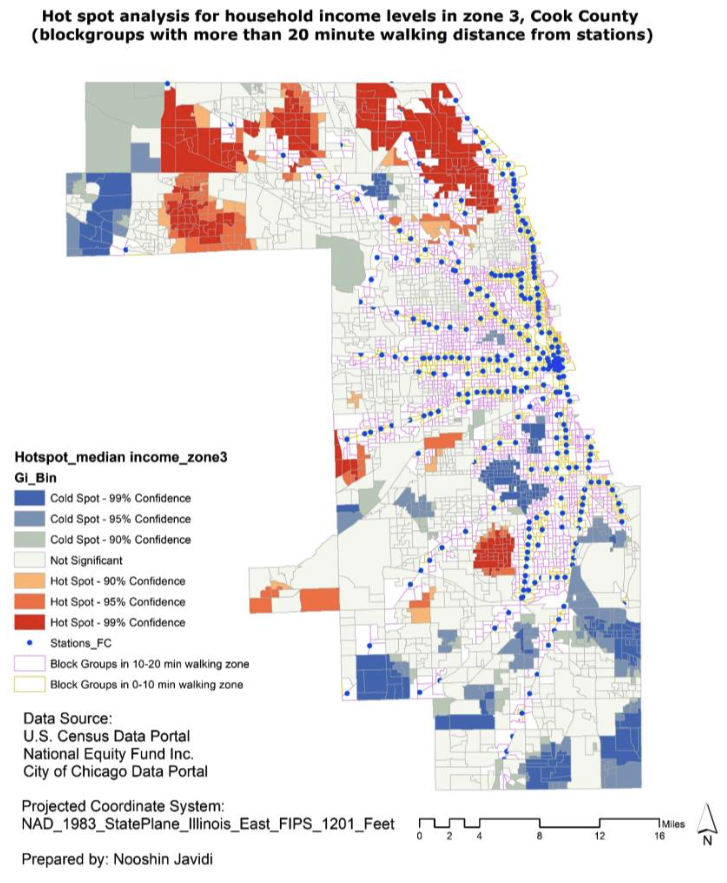
5. Impact of Walkable Access to Transit on Foreclosure Rates Heading link
Author: Nooshin Javidi
In this project within the study area of Cook County, it is intended to find the impact of walkable access to transit on foreclosure rates which is a factor that indicates how TOD impacts the housing market. Based on the TOD studies, it is expected to see the Areas within TOD zones to have lower foreclosure rates in Cook County area and to have a relatively stable Real-State market compared to surrounding areas. GIS tools are helpful in finding the foreclosure rates and densities within TOD zones in comparison with surrounding areas to see if TOD does have any impact on the housing market or not.
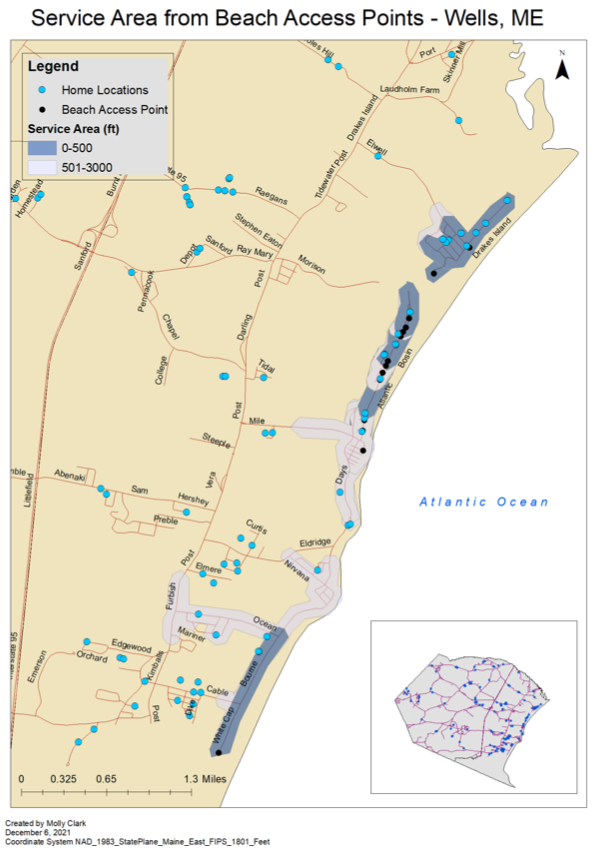
6. GIS and Valuing Costal Erosion Heading link
Author: Molly Clark
This project used a hedonic pricing method to value the impact of coastal erosion by examining the property values of single family homes located in Wells, Maine. Molly used the coastal town of Wells, Maine as a case study in how GIS can be used when estimating the cost of coastal erosion. Wells’ economy relies heavily on tourism; its year-round population is approximately 9,600 as of 2010 and increases to approximately 30,000 during the summer tourist season. The town estimates that there are at least 3,400 seasonal housing units, indicating that the housing market is a driving indicator of the economy. The town has four public beaches along its coastline, which is a major recreational amenity in the town.
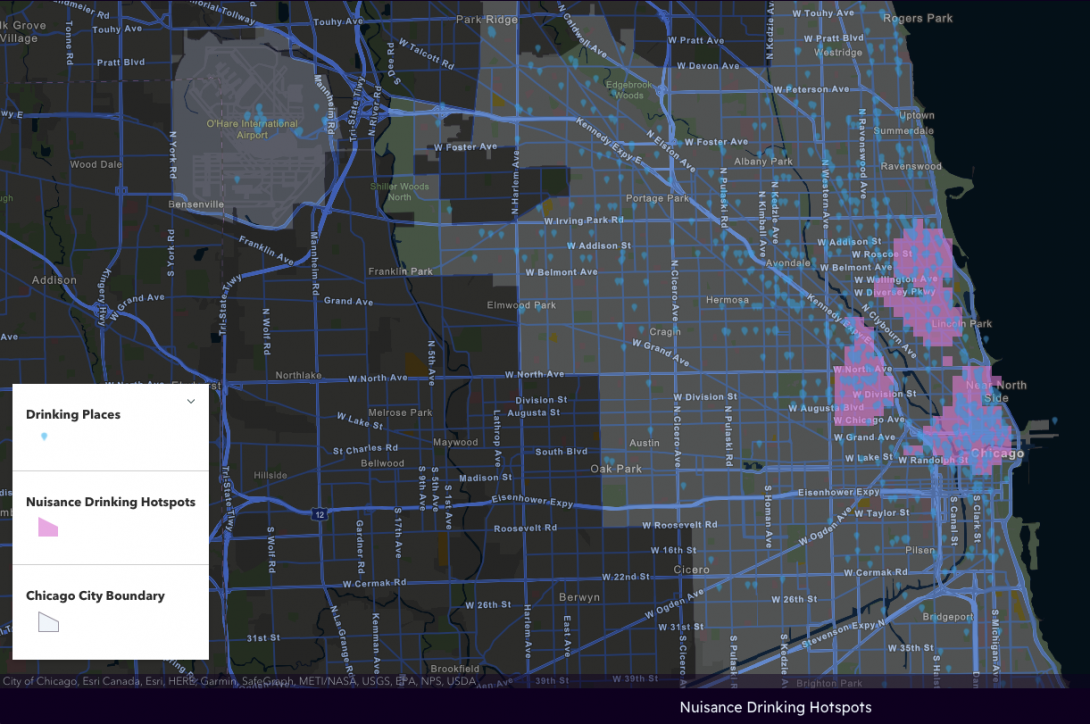
7. Nightlife and Nuisance in Chicago. An preliminary picture of the citywide drinking scene Heading link
Author: David Schottky
Cities run on twenty four hour schedules, but historically, the nighttime has been pushed to the margins in most planning contexts. Different agencies could be responsible for certain elements, such as police departments and liquor licensing commissions, but the nighttime was rarely thought about holistically. Previously often seen as nuisance to be managed, many cities across the globe are taking a more positive approach to managing the night: how can cities make the nighttime economy accessible and inclusive of everyone? This approach brings in not just nighttime revelers, but workers in the nightlife industry and other nocturnal industries, and residents that live in popular nightlife districts. It also begins to acknowledge some of the drawbacks come from increased police and security presence, such as targeting of marginalized communities.
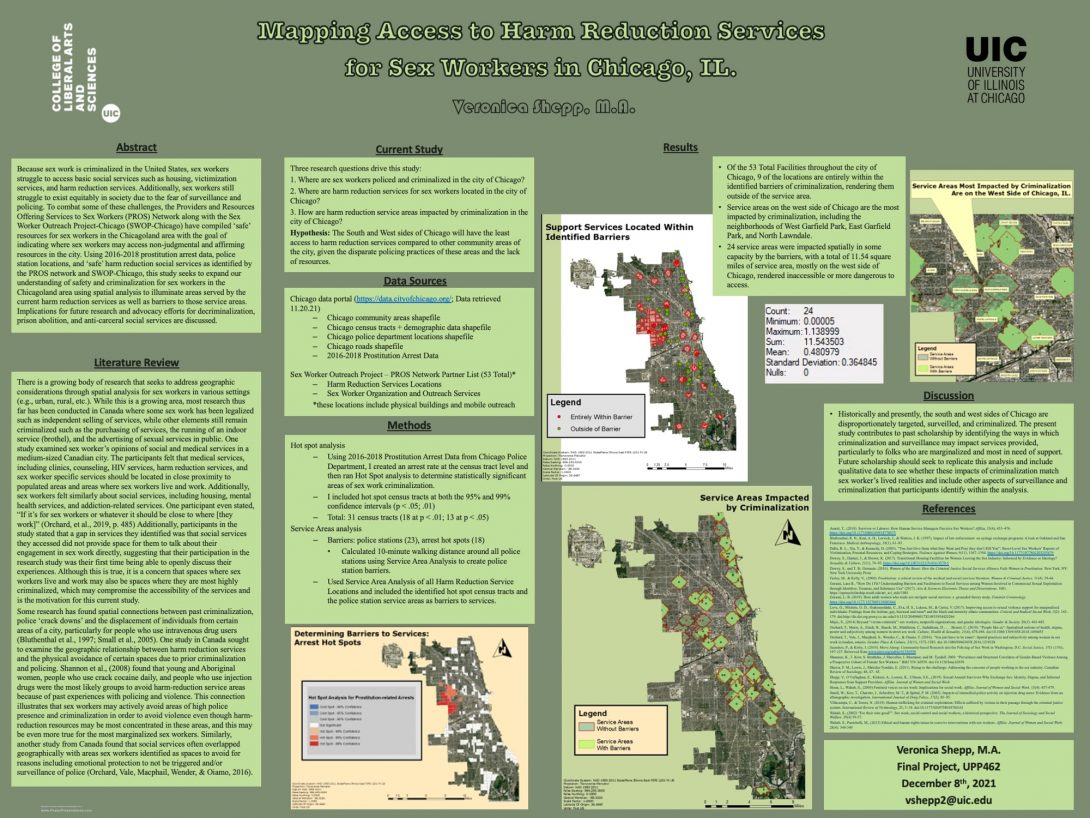
8. Mapping Access to Harm Reduction Services for Sex Workers in Chicago, IL Heading link
Author: Veronica Shepp
Because sex work is criminalized in the United States, sex workers struggle to access basic social services such as housing, victimization services, and harm reduction services. Additionally, sex workers still struggle to exist equitably in society due to the fear of surveillance and policing. To combat some of these challenges, the Providers and Resources Offering Services to Sex Workers (PROS) Network along with the Sex Worker Outreach Project-Chicago (SWOP-Chicago) have compiled ‘safe’ resources for sex workers in the Chicagoland area with the goal of indicating where sex workers may access non-judgmental and affirming resources in the city. Using 2016-2018 prostitution arrest data, police station locations, and ‘safe’ harm reduction social services as identified by the PROS network and SWOP-Chicago, this study seeks to expand our understanding of safety and criminalization for sex workers in the Chicagoland area using spatial analysis to illuminate areas served by the current harm reduction services as well as barriers to those service areas. Implications for future research and advocacy efforts for decriminalization, prison abolition, and anti-carceral social services are discussed.
9. Tracking Urban Land Use Change with Historical Aerials Heading link
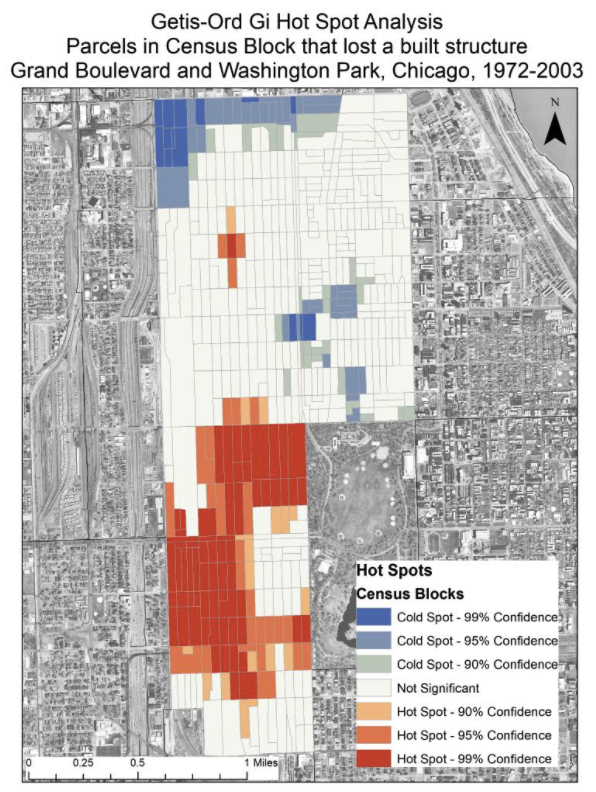
Author: Chris Silber
Chris explored parcel-level changes in the built environment through the interpretation of aerial photos in Grand Boulevard and Washington Park (Chicago). Granular historical building permit and demolition permit data are often hard to come by. In Chicago, digital building permit data is only available back to 2006. This lack of readily usable data hinders the analysis of historical land use change in Chicago’s Community Areas. This project’s goal was to test the possibility of utilizing historical aerial photography to determine the approximate dates that properties lost building structures, and to analyze this data to gain more insight into how vacant land has developed over time in the Grand Boulevard and Washington Park Community Areas.