UPP 462 | Spring 2023
Final Project Showcase
In Spring 2023, the class produced 10 team and individual projects on a variety of topics. The purpose of this final project is for students to demonstrate their ability to integrate multiple advanced GIS tools (e.g., Network Analyst, ModelBuilder, Python, Spatial Statistics, 3D Mapping, and Spatial Analyst) to address some questions – hypothetical or real – of a geospatial nature. Students have several weeks at the second half of the semester to develop research questions, investigate the topic of their interest, explore GIS tools to address their questions and produce the final visuals. The final result includes an ArcGIS StoryMap report where maps and additional information are used to illustrate methods and communicate findings. Thanks to all the students for your hard work during the semester.
Instructor - Anton Rozhkov
1. Trends from the 2023 Chicago Mayoral Elections Heading link
Authors: Madelyn Morgan and Ievgeniia Dulko
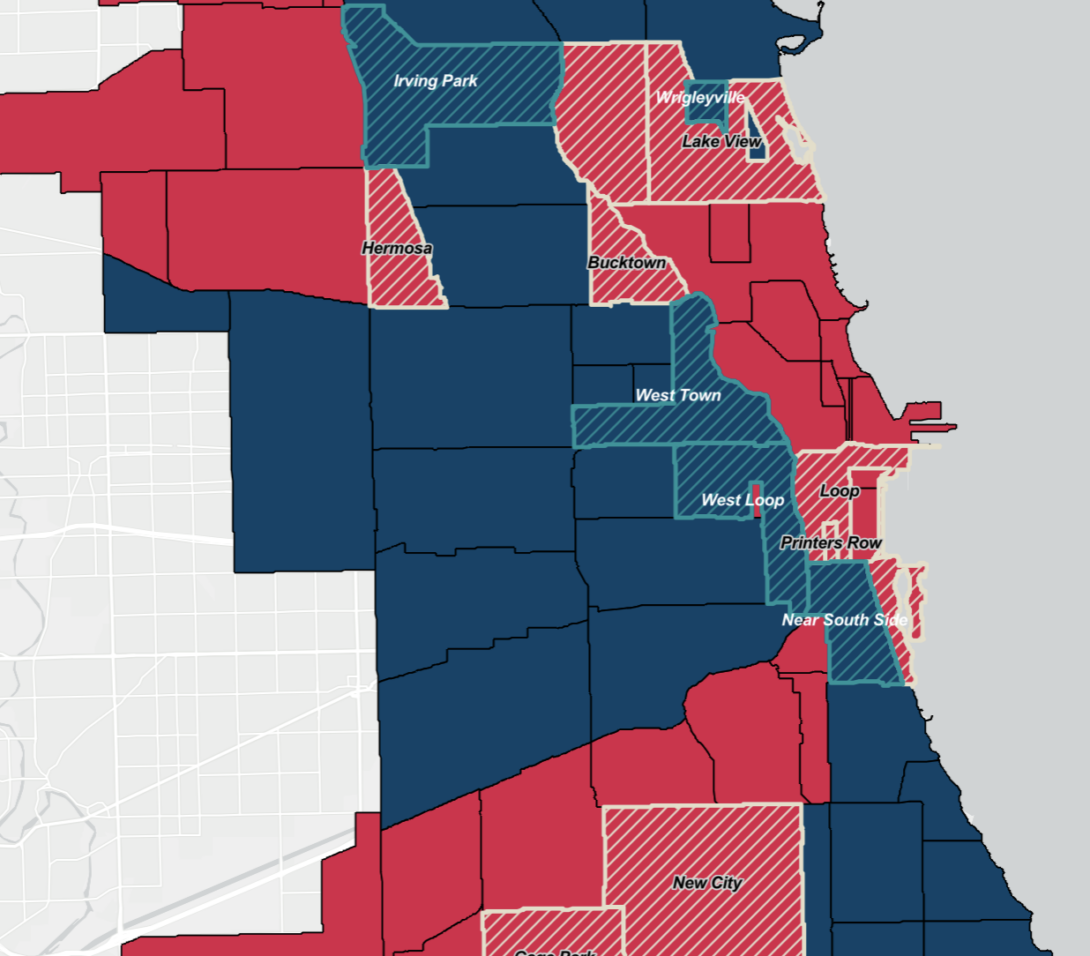
After a tight mayoral election, which included a runoff in April 2023, Chicago voters narrowly elected Brandon Johnson over Paul Vallas. In this project we wanted to explore two main questions: Which neighborhoods had the smallest margin between the two candidates and what demographic trends might explain these results? Also, how can we understand the election results based on neighborhood level, when the data we have represents precinct geography?
2. Mapping Vulnerability to Lead Water Exposure Heading link
Authors: Sebastián Villa-Rodriguez
This project visualizes census tracts with the highest risk of lead exposure from lead service lines in Chicago. Although the federal government prohibited lead-based paint in 1973, lead service lines in new housing construction were not banned in Chicago until 1986. Historically, prior Chicago mayors have not addressed this problem and today there are an estimated 400,000 service lines, the most of any U.S. city. This study develops a vulnerability index to measure risk of lead exposure in households’ water supply based on sociodemographic and housing data (Median Household Income, Residences Built Pre-1980, Single Family or Two Flat Residences, Population without Health Insurance, People of Color (Black and/or Latinx), Presence of Children).
3. Banking and Public Health: A look at banking deserts in Boston, MA Heading link
Authors: Zoë Harris
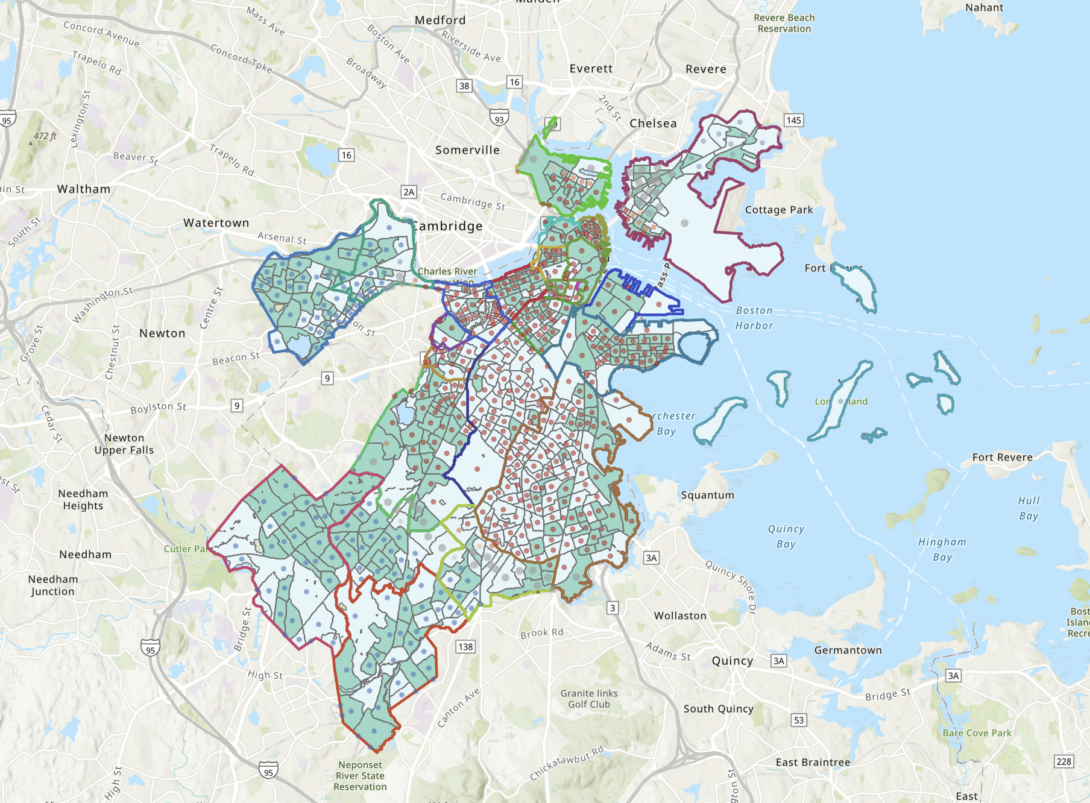
Social determinants of health (SDOH) are the “conditions in the environments where people are born, live, learn, work, play, worship, and age that affect a wide range of health, functioning, and quality-of-life outcomes and risks” as defined by Healthy People 2030. One of the social determinants of health is Economic Stability . When you have a stable income, you are more likely to be healthy since you are more likely to afford healthy foods, safe housing, adequate health care, and appropriate education. The research question of this study: is there a correlation between density of banks, check cashing, and payday lenders and demographic indicators of social determinants of health?
4. Analyzing Potential Areas For Divvy Expansion Heading link
Authors: Sean O’Rourke
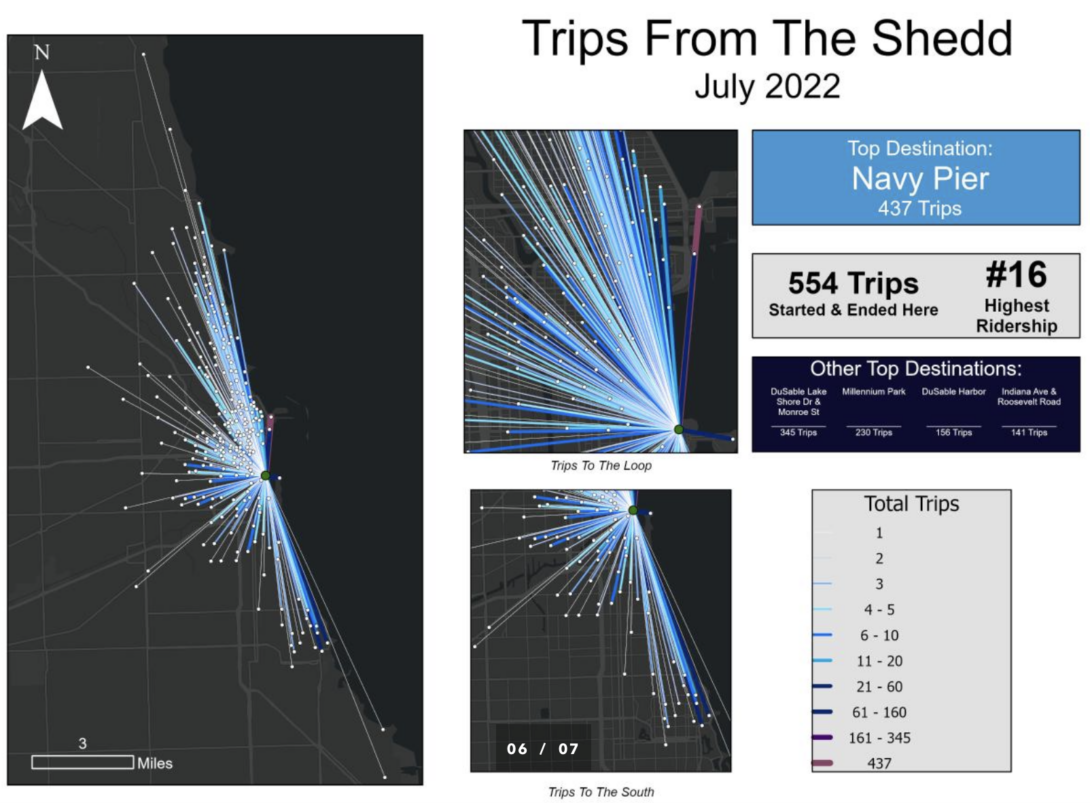
Divvy is Chicago’s bike share system which has been around since 2013. It is run by the Chicago Department of Transportation (CDOT) but was sold to Lyft in 2018. Today, it serves people through over 829 stations from all around the city. Many areas of the city still lack Divvy service and there are existing holes within the network. In order to be a truly equitable service, Divvy needs to serve everyone across the city. The goal of this project is to identify different areas where Divvy could expand its service as well as identify different holes within the existing network of stations. GIS offers advanced tools that could be used to identify gaps within the Divvy network and determine good locations for potential expansion. This is a spatial problem and looking at it spatially helps reveal trends that might not be picked up.
5. Comparing U.S. Domestic Migration with Climate Livability Heading link
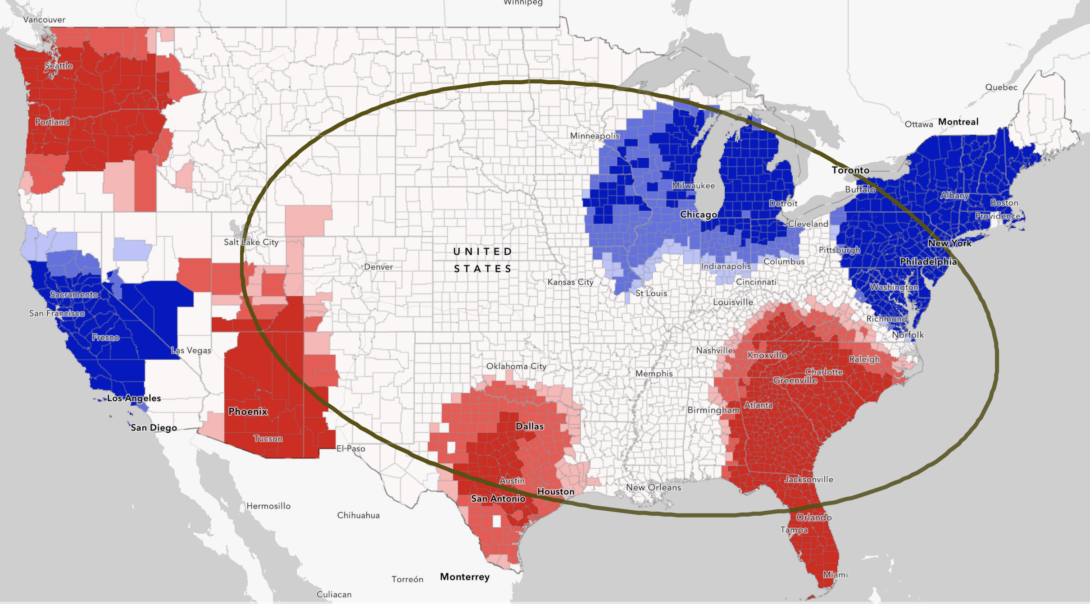
Authors: Margaret Schafer
The Rust Belt to Sun Belt migration refers to the movement of United States (U.S.) populations from the industrial region surrounding the Great Lakes (“the Rust Belt”) to the southern region stretching from coast-to-coast (“the Sun Belt”) (Shermer, 2013). Beginning in the 1950s when manufacturers left the Rust Belt cities. Tit continues today, with Sun Belt cities such as Phoenix experiencing the highest growth rates in the country (U.S. Census Bureau, 2021). As climate change progresses and temperatures rise, increasing portions of the United Sates (U.S) are predicted to become unlivable. At a glance, these portions seem to intersect with the Sun Belt, which is already known for its hot weather. With this knowledge, the hypothesis is that domestic migrants within the United States are moving towards the very areas predicted to be the “least livable” as climate change progresses. It was done by comparing data on domestic migration with predictions on climactic livability by the end of the century.
6. Pathways to Advanced Manufacturing: Chicago's Youth Employment Pipeline Analysis Heading link
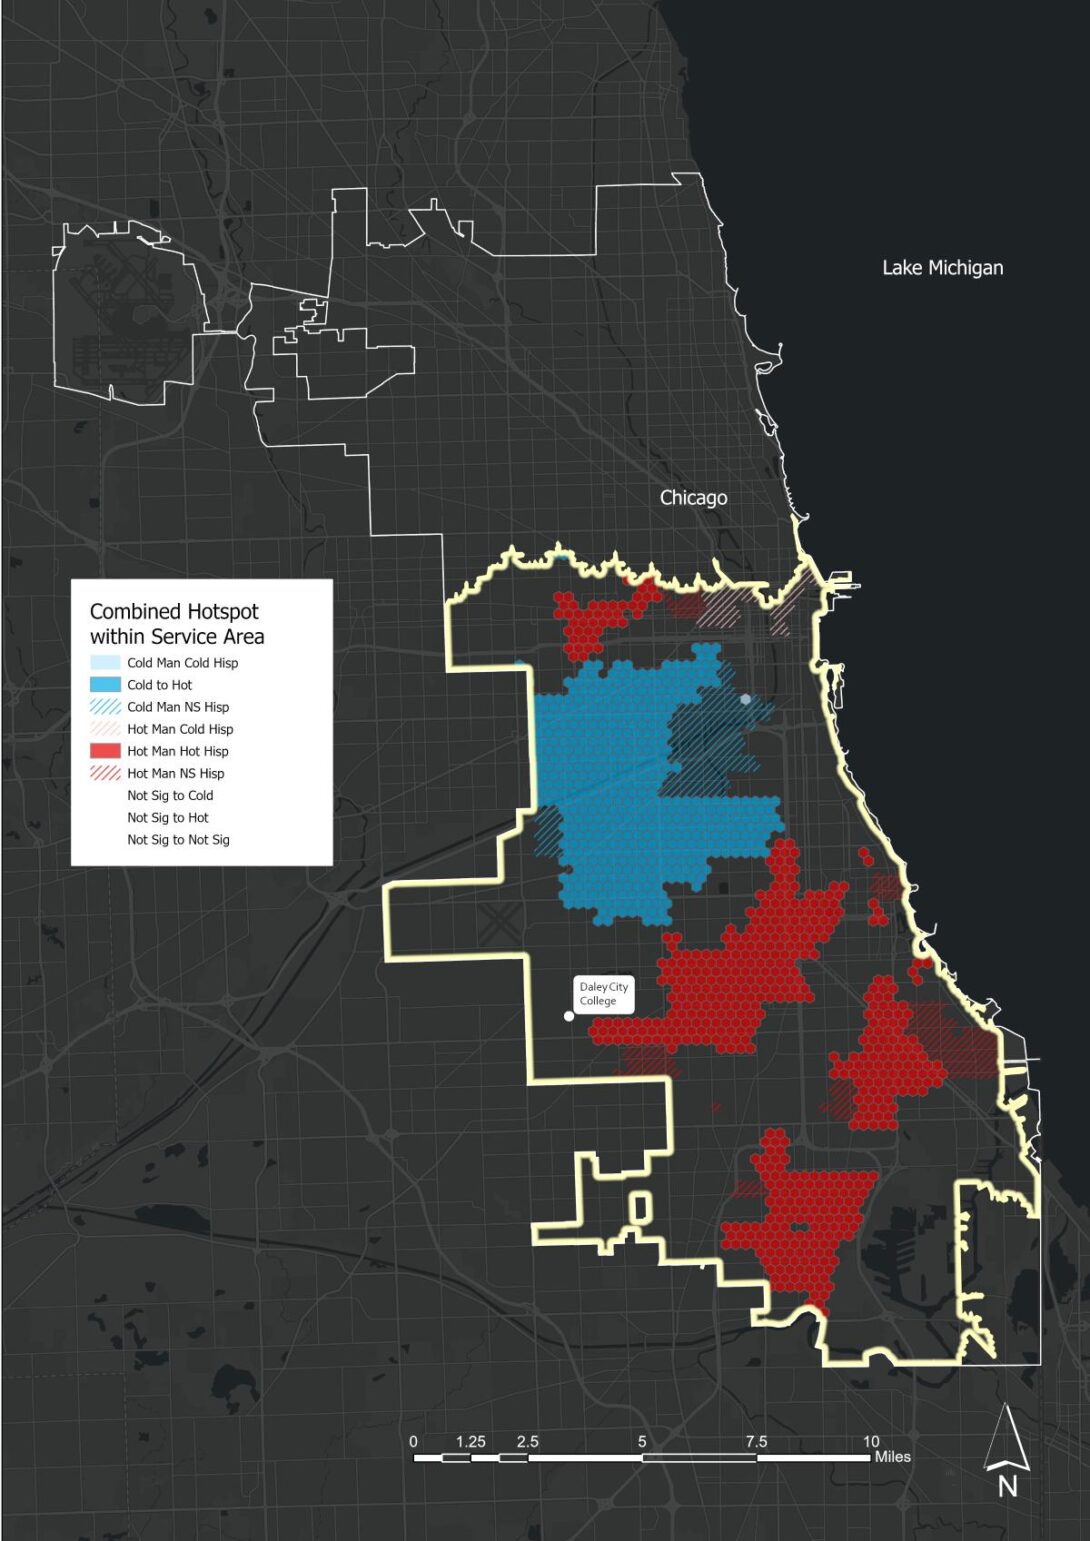
Authors: Gabriel Conners, Max Kerr Hackmann, and Punya Vats
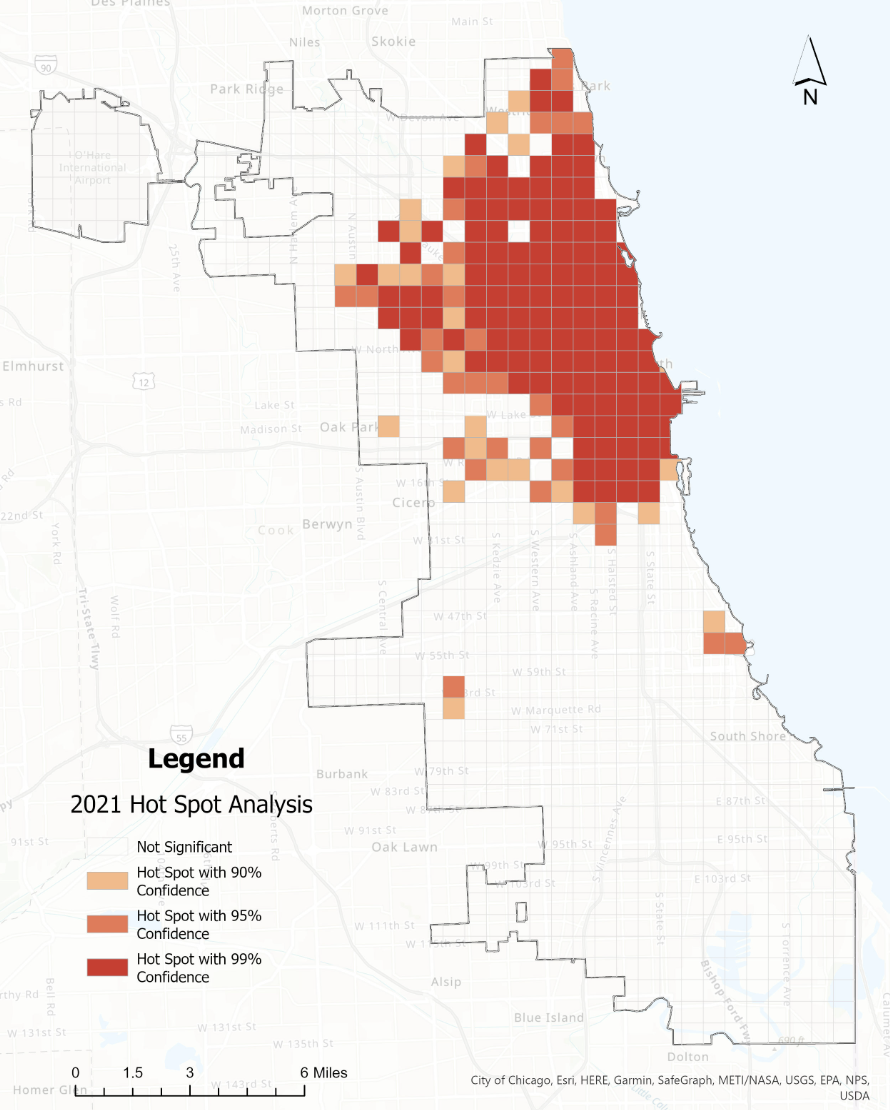
In recent years, Chicago has employed 20,000 – 30,000 youth during Summer through the One Summer Chicago program. Mayor Johnson’s push for doubling this number in his first 100 days is ambitious (Brandon Johnson’s teen employment goal could be tough | WBEZ Chicago), though it sends a strong signal of strategies the city is taking to set strong foundations for the future of our youth and communities. Unemployment among Chicago’s youth is a roadblock for building better communities. While about half of Chicagoans live in areas where youth unemployment average 7.5%, the other half sees rates of youth unemployment that often exceed 20%, and median wages that trail wealthier parts of the city by nearly 30%. (Engel, Keller, & O’Dell, 2018). These disparities follow racial and ethnic lines. In areas with high youth unemployment, 45 percent of the population is black, 33 percent is Hispanic, and only 16 percent is non-Hispanic white. Tackling youth unemployment is a nested challenge of public safety, equity, and economic resilience.
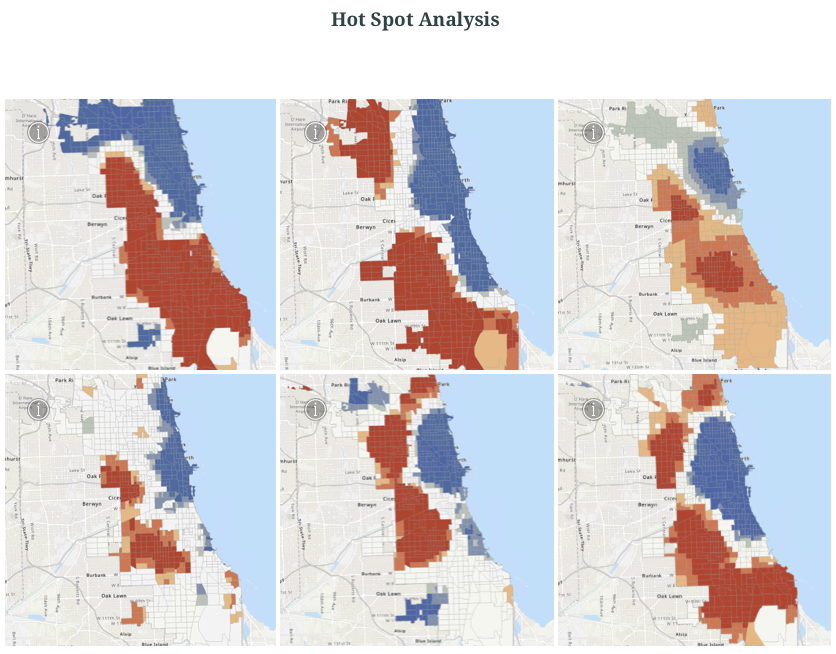
We map statistically significant areas of growth and decline in manufacturing employment from 2011 to 2021. This analysis, alongside a Hispanic population density map, provides a spatial representation of potential focus areas for programming. The goal of this research is to provide a data-driven snapshot of trends that might inform the City of Chicago’s priority initiatives to serve the future of our youth, communities, and address unemployment.
7. Spatial Patterns in Crime: A Closer Look at Burglaries across Chicago Heading link
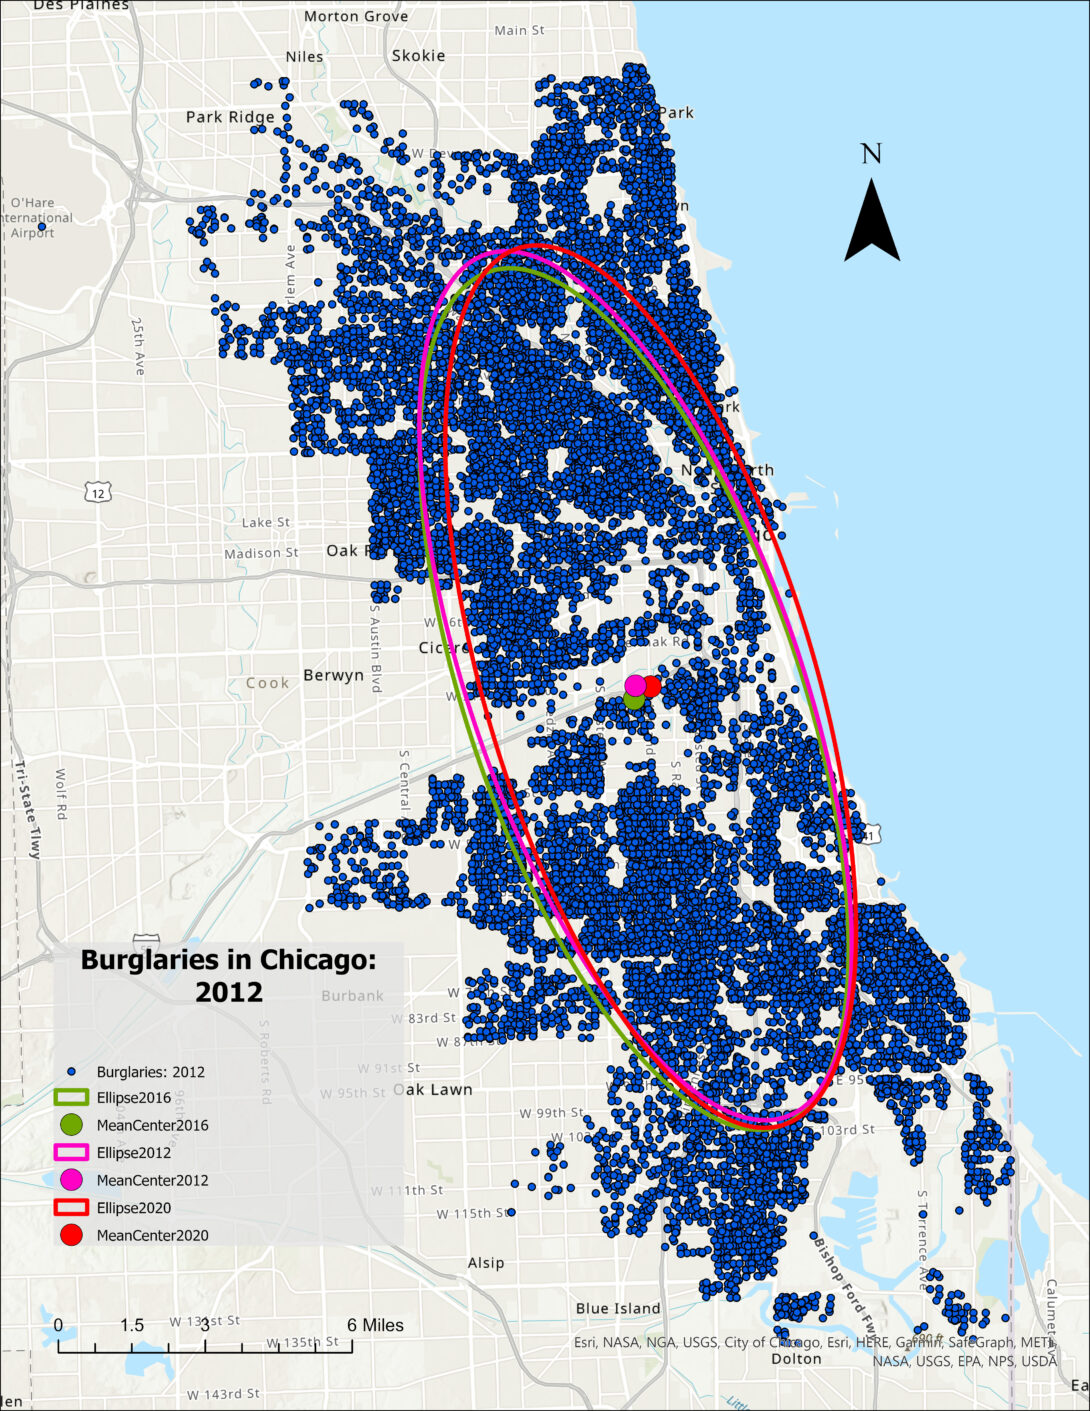
Authors: Antonio Wright and C. Lucio
It is an often noted statistic in the social sciences that crime across the United States has been in decline for the last several decades. However, it is also true that crime has never been more sensationalized than it is today. With the advent of the social media and the 24-hour news cycle, people are so hyper aware of crime that it appears to them that crime is forever encroaching on their communities. Although a full analysis of this phenomenon is beyond the scope of this project, it very much colored the questions that we asked while examining the data. The impetus behind this project in its original form was to see if there is some link between times of economic hardship and the spatial distribution of property crimes. The hypothesis was that if economic hardship increases, then property crimes will migrate to wealthier parts of the city
8. Spatial Patterns across residential front yards in Chicago Heading link
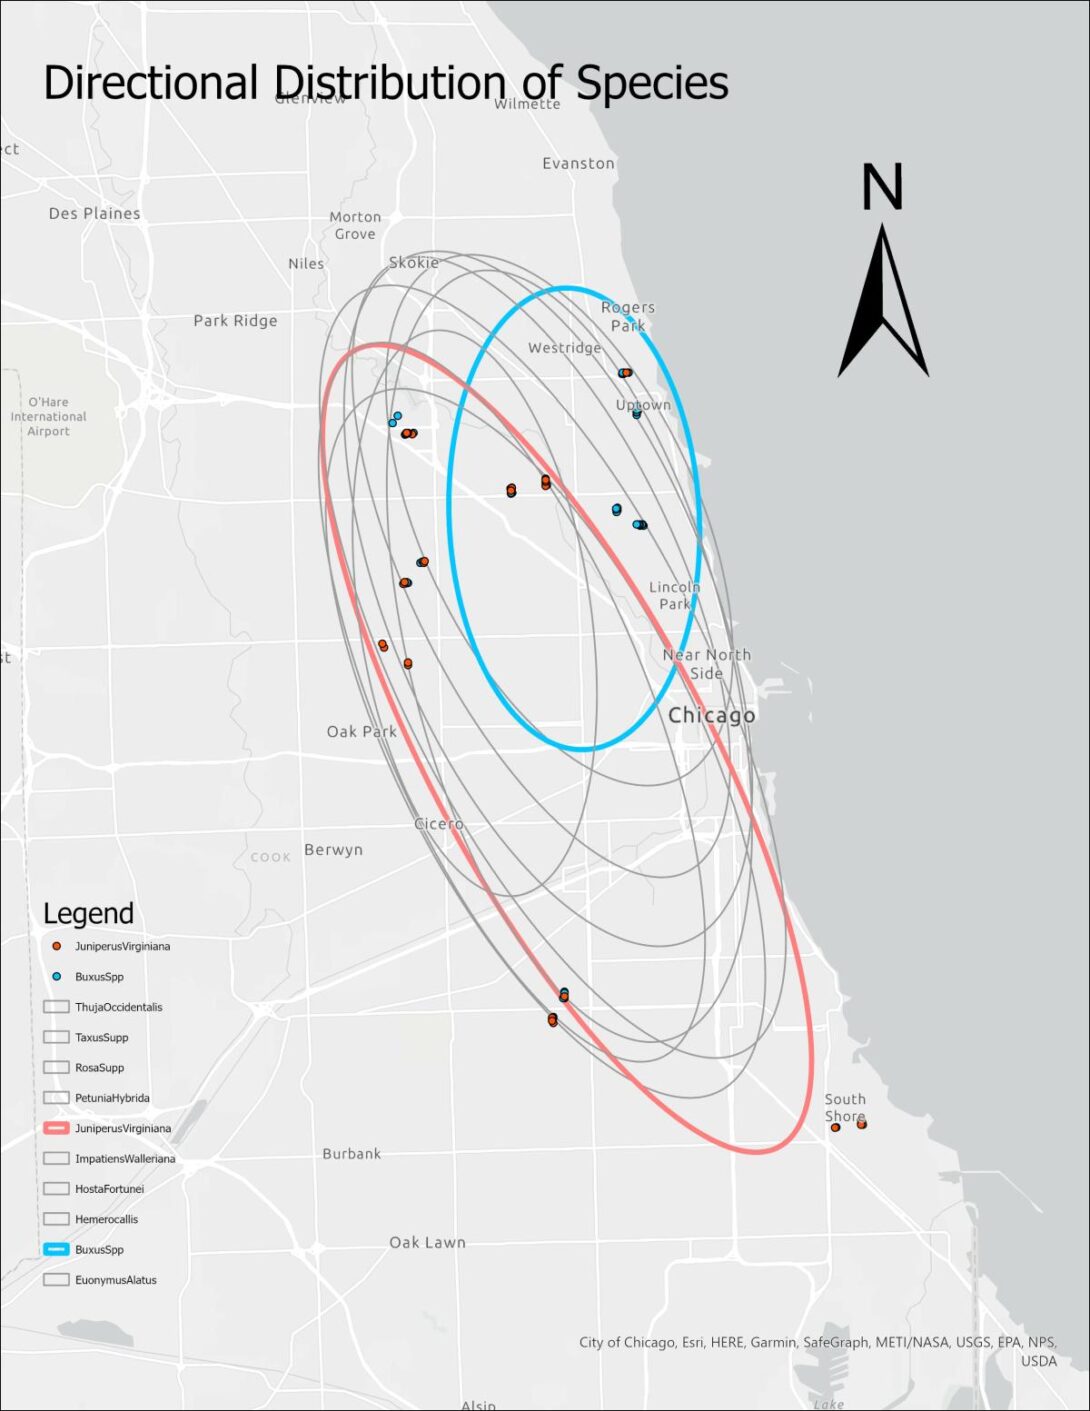
Author: Soraida Garcia and Nirupama Jayaraman
As urban areas grow in number and extent, urban plant diversity is becoming more important to understand and preserve. Urban plant communities provide ecosystem services to residents and habitat for many species of wildlife. Residential land may be especially important for plant diversity, as the amount of land and vegetation in private yards and gardens is often greater than the amount preserved as urban open space. We argue that front yards are significant to study because they cover a lot of land in urban spaces. Further, front yards provide habitat for a variety of wildlife found in urban areas. Finally, we argue that by paying attention to the front yard management through identifying choice of species, maintenance schedules etc. can help understand social and economic conditions of the resident through markers such as income, education and decision-making.
9. Food Desert Mapping and Analysis in Marion County, Indiana Heading link
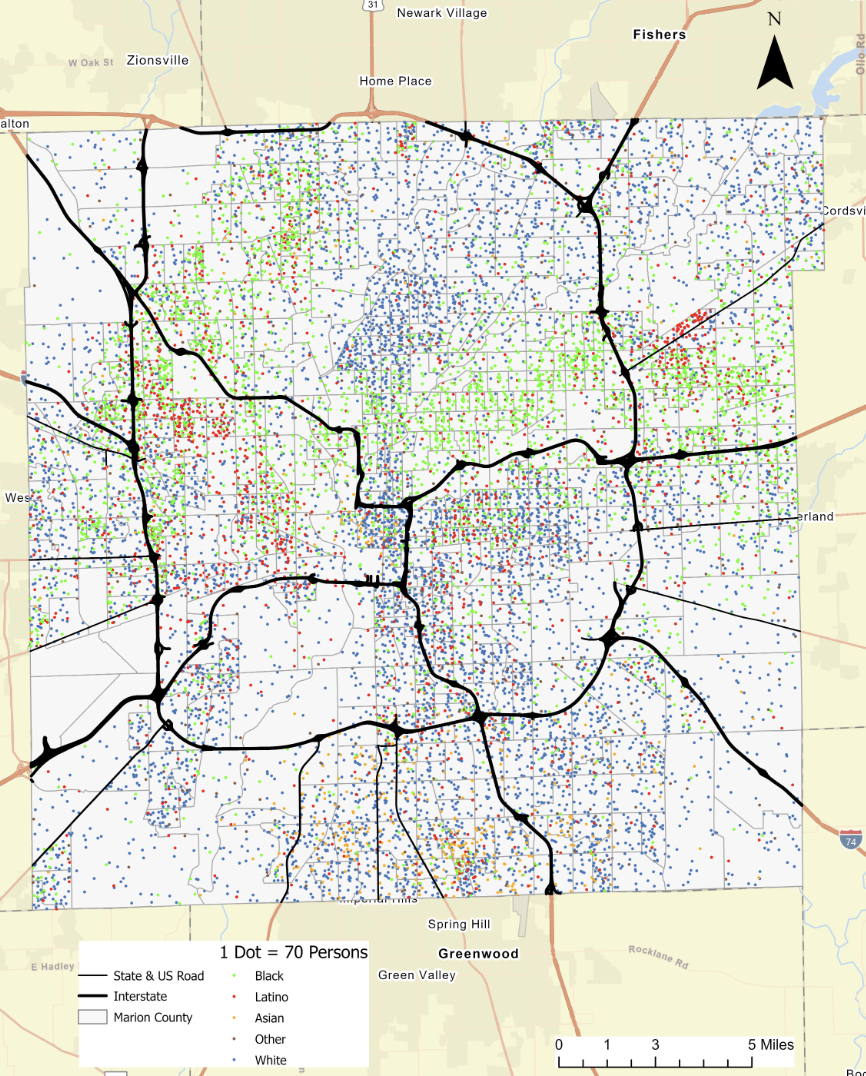
Authors: Olivia Knox
This project aims to analyze the prevalence and impact of food deserts in Marion County, Indiana. According to the United States Department of Agriculture (USDA), a food desert is where at least 33 percent of the population resides more than one mile from a supermarket or large grocery store in urban areas. The project will investigate the areas of Marion County that do not meet the USDA’s food desert criteria and explore their social and economic data.
10. A Bicycle Accident Study in Chicago, Illinois Heading link
Authors: Zacharia McKee
Between 2015 to 2022 there were over 10,000 bike crashes in Chicago. With biking becoming an increasingly popular mode of transportation in Chicago, there is a need to better understand the prevalence and trends of bicycle accidents that could potentially inform future infrastructure or safety initiatives. The aim of this research was to create a visual representation of the locations of bicycle accidents that took place in Chicago from 2015 to 2022. The study also aimed to identify any possible patterns or clusters of accidents. Initially, it was hypothesized that severe and fatal injuries would be more likely to happen outside of bike lane service areas. However, the findings of the study disproved this assumption.